A. Goals: The goals of epidemiologic studies are to discover the causes of disease, detect and quantify risk factors, increase understanding of carcinogenesis, and evaluate preventive measures and treatment modalities.
B. Methods
1. Observational studies
a.Descriptive studies are designed to describe patterns of disease-related data in populations over time to identify clues to etiology. Data from descriptive studies are often used to develop public health priorities such as screening and prevention activities.
b.Analytic studies are designed to test hypotheses about relationships between cause and outcome. There are three types of analytic studies.
(1)Cohort studies are usually prospective, requiring observation of a disease-free population for a long period of time to see who develops disease (eg, the Framingham Heart Study).
(2)Case-control studies examine data collected from people already diagnosed with a disease (cases) as well as data from similar people without disease (controls). Data collected include questionnaires, medical histories, and biologic specimens.
(3)Molecular and genetic epidemiologic studies include elements of both cohort and case-control studies to develop understanding of the role of genetic variation and mutation in cancer development.
2. Intervention studies use data obtained from observation and analytic studies to test means of disrupting the process of cancer development. Studies usually involve dietary, chemopreventive, screening, or lifestyle interventions.
II. Cancer Epidemiology
A. Epidemiology is the scientific study of factors influencing the frequency and distribution of disease in human populations. Cancer epidemiology is the study of these factors in relation to malignancies.
B. Epidemiologic studies are conducted to monitor the occurrence and outcomes of cancer in populations. These studies enable identification of trends in cancer occurrence and complications, as well as target areas and populations most in need of cancer screening, education, and treatment programs.
C. Descriptive epidemiologic studies deal with vital statistics, whereas analytic epidemiologic studies are concerned with causes of disease. A variety of terms are used in epidemiologic studies.
1.Incidence rate is the number of new cases in a given population during a specified time period. It measures the probability of developing a disease and compares rates of disease development between populations.
2.Prevalence rate measures existing disease in a population during a specified period of time. It reflects the burden of disease on a population and is used in the planning and distribution of health care services.
3.Mortality rate measures the number of deaths from a disease in a population during a specified time period.
4.Survival measures the number of people with cancer who are alive 5 years after diagnosis. (Note: This is not the same as cure rate, which measures disease-free intervals of 5 or more years.)
5.Morbidity is the state or condition of having a disease. This is often used to describe complications or consequences of having a disease.
6.Host is a person who is susceptible to disease. Many different host characteristics are studied in epidemiology, including age, sex, race/ethnicity, genetic predisposition, and preexisting disease.
7.Environment includes factors to which the host is exposed. Characteristics studied include place (which may be the home, workplace, city, town, region, or country), nutrition, occupation, and personal habits.
III. Cancer Statistics:
A variety of cancer statistics are reported annually for the United States. These statistics include the number of new cases of cancer (incidence), the number of deaths due to cancer (mortality), and information about how long individuals survive after a diagnosis of cancer (survival).
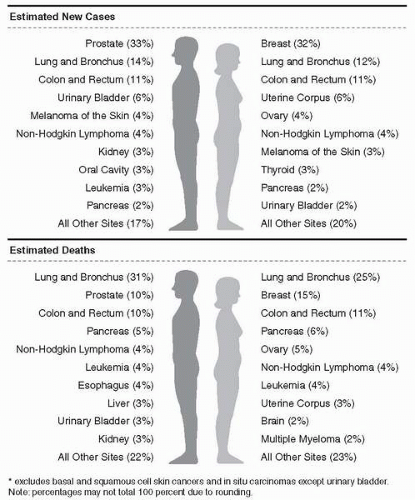
A. Incidence: The American Cancer Society estimates that there will be 1.3 million new cases of cancer diagnosed in 2003 (Fig. 3-1). This includes cancers of all types except carcinoma in situ (except for urinary bladder), and basal and squamous cell skin cancers.
B. Mortality: Twenty-three percent of all deaths in the United States are due to cancer. This translates to about 1,500 deaths per day (Table 3-1).
1. Cancer is second only to heart disease as the leading cause of death. However, when deaths are categorized by age and sex, cancer ranks first as the cause of death among females age 40 to 79 and among males 60 to 79.
2. Lung cancer is the leading cause of cancer mortality among men and women of all ethnic groups, followed by breast, prostate, and colorectal cancers.
3. Overall, the cancer mortality rate has been decreasing slightly since 1994.
C. Survival: Cancer survival rates are increasing.
1. Over the past 60 years, the percentage of people surviving for 5 years after cancer diagnosis has improved from less than 20% to about 40%.
2. This figure represents the “observed” survival rate for cancer patients. When adjusted for average life expectancy (reflecting deaths due to other causes), a “relative” 5-year survival rate of about 62% is seen for all cancers combined.
3. Increased survival rates most likely reflect improvements in patient management, promotion and acceptance of early detection methods, and the availability and use of medical care.
Figure 3-1. Ten leading cancer types for the estimated new cancer cases and deaths, by sex, US, 2003. (Jemal, A., et al. [2003]. Cancer statistics, 2003. CA: Cancer Journal for Clinicians, 53,5-26.)
D. Several factors impact the patterns of cancer incidence, mortality, and survival. Chief among these are age, gender, and race or ethnicity.
1. Age: Cancer incidence increases with advancing age. Cancer among children is relatively rare.
2. Gender: Overall incidence of cancer is higher among males than females, with approximately 1 in 2 males and 1 in 3 females diagnosed in their lifetime. Rates are age-adjusted (ie, incidence for females from birth to age 39 is 1 in 52, and for males 1 in 69). Incidence rates increased among females from 1987 to 1999 by about 0.3%, probably due to increased rates of lung cancer. Incidence rates among males remained relatively stable between 1995 and 1999. Cancer death rates declined in males by 1.5% per year and in females by about 0.6% per year between 1992 and 1999.
a. Males: Prostate cancer is the most frequently occurring cancer, comprising 33% of cancers in men and affecting 1 in 6 males by age 85. Lung and colorectal cancers have the second and third highest incidence. The highest mortality from cancer is from lung cancer, followed by prostate and colorectal cancers.
b. Females: Breast cancer will occur in approximately 1 out of 8 women by age 85. It is the most frequently occurring cancer among women, accounting for 32% of all cancers diagnosed. The next most common malignancies are lung and colorectal cancers. Deaths from lung cancer have surpassed those from breast cancer.
3. Race/Ethnicity: Cancer incidence and mortality vary widely among racial and ethnic groups. Racial and ethnic groups are divided into five general categories: African American, Asian/Pacific Islander, Hispanic, Native American, and white. The US Census Bureau estimates that, by the year 2050, Hispanics will comprise about 25% of the US population. African Americans, Asian/Pacific Islanders, and Native Americans combined will make up another 25%. Although targeted data collection has been lacking, some trends can be pinpointed.
a. African Americans: For the most common cancer sites, African Americans have significantly higher rates of incidence and mortality than any of the other racial and ethnic groups. Exceptions to this are breast cancer incidence and lung cancer mortality.
(1) Specifically, African Americans have the highest incidence and mortality rates for cancers of the prostate, esophagus, larynx, pancreas, and multiple myeloma. Incidence of prostate cancer among African-American males is the highest in the world.
(2) The rate of new cancers in African Americans exceeds that of white Americans by about 10%, of Hispanics and Asian/Pacific Islanders by 50% to 60%, and of Native Americans by 100%.
(3) Mortality from all cancers is 30% higher than in whites, and more than twice as high as among Hispanics, Asian/Pacific Islanders, and Native Americans.
(4) The largest decrease in mortality rates between 1995 and 1999 occurred among African-American males. However, survival continues to be lower in the African-American population as compared to whites.
(5) Later diagnosis of cancers, differences in the quality of health care, and comorbid conditions probably contribute to poorer survival.
b. Asian/Pacific Islanders: This group has the lowest rates of prostate cancer incidence. However, there is a very high rate of liver cancer, particularly among Southeast Asians, which is linked to high rates of infection with hepatitis B. Gastric cancer incidence and mortality are high among Japanese, Korean, and Vietnamese populations.
Table 3-1 Trends in 5-Year Relative Survival Rates*(%) by Race and Year of Diagnosis, US, 1974 to 1998